Z Table is a type of statistical table. It is also known as the standard normal table or Z score table. Also, some people calling it a unit normal table. Read this article to know various things related to the Z score table.
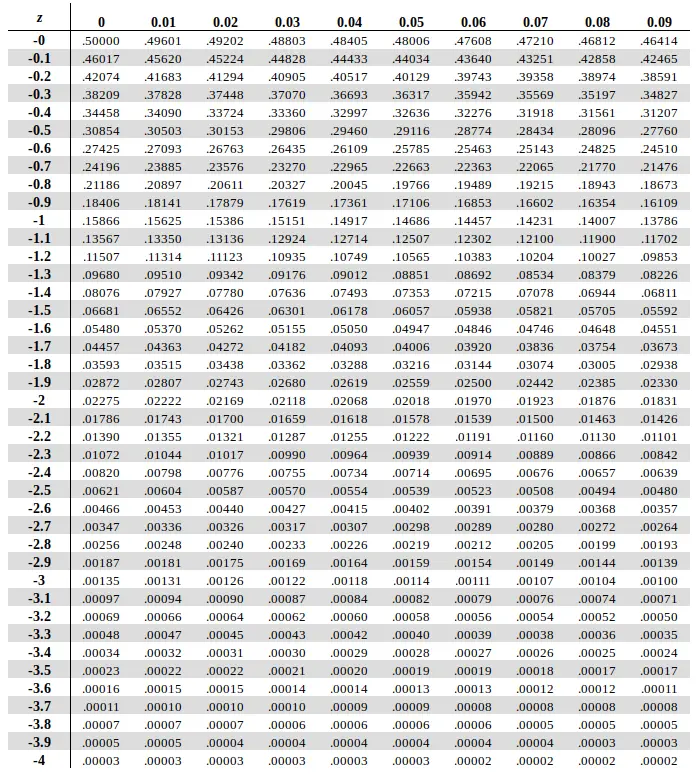
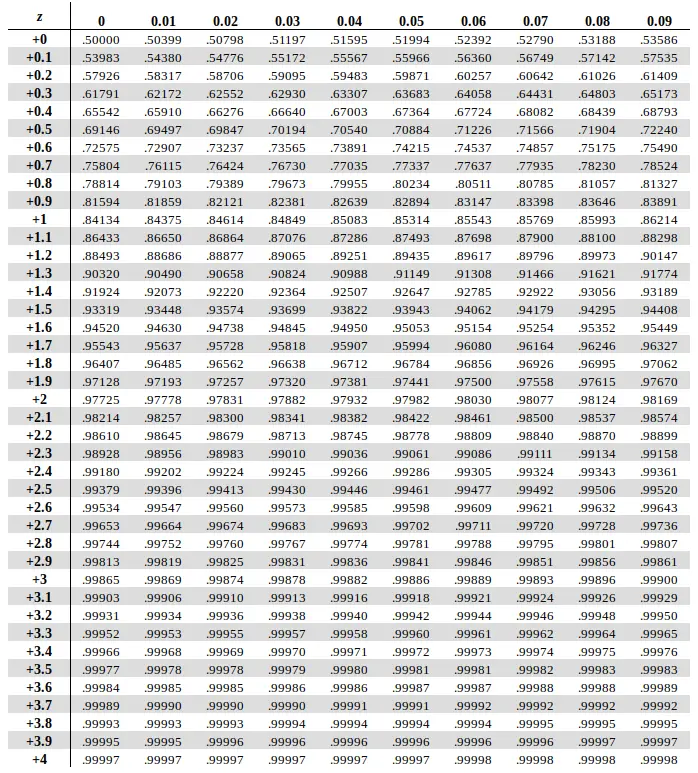
There are two types of Z-Table that are given below. The negative Z table includes values from 0 to -4 and the positive includes values from 0 to +4.
Negative Z Table
Positive Z Table
Z table, an alphabetical term in the world of mathematics has its interesting origins from history. A French mathematician Abraham de Moivre was interested in gambling and used to find probabilities of the coin flips. So, he devised a bell-shaped figure on the graph that we usually call the z curve. Z table is simply a standard normal distribution of percentage from 1 to 100. It reflects the area of the z curve on the graph for standard deviations.
For instance, standard distribution is using to show the variables of height, weight, and strength. This phenomenon was first considered by Lambert Quetelet. He was a Belgian astronomer and he linked this distribution and the z curve.
The z table has numerous values. It is using to find the probability of statistic value. Whether it is above, below, or between the values of normal distribution. Remember, the z- score shows the number of standard deviations where the value lies below the mean. It is positive when it lies above the mean.
Now, the question arises about why there are two separate z tables? Because we have two values which are positive and negative. So, this approach makes better understanding as well as the solution to the problem. The left defines the negative values and the right shows the positive values.
Usage of Z score table
Conversion to a z-score:
The formula to convert a sample mean, X, to a z-score is:
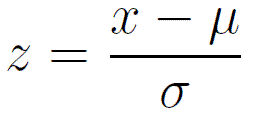
Here μ is the population mean, σ is the population standard deviation, and x is the sample size.
Area corresponding to z-score:
After this calculation, you need to look up in the table. Don’t get confused with the right and left side of the mean.
Sketch a conclusion with a diagram:
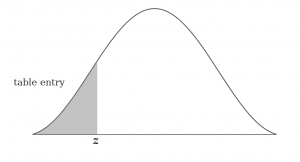
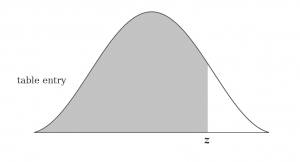
The area below the z curve is the one, that needs to be calculated. It means the shaded portion below the curve is the answer and it gives you a better idea of the figures.
The three convocations:
- The cumulative, from the mean that it provides a statistic value between 0 and Z.
- The cumulative, that provides a statistical value less than Z or the area of below the distribution.
- The complementary cumulative, which provides a figure more than Z. It is equal to the area of the distribution above Z.
Let’s understand this concept with an example:
Example1
The distribution of test scores has a mean of 80 and a standard deviation of 5.2. State the percentage of score that lies below 73.
Solution:
According to the question,
The area below the z curve starts from the left side of the graph.
73 as z score:
z = 73 – (80 / 5.2) = 1.34615
Now, you can trace the value in the z table and that will take you to the percentage score of -1.34.
Example2
The normal curve shows the mean as 0 and the standard deviation is 1. Let’s assume that the area within is 1.45 standard deviation above the mean. The shaded portion is 0.4265.
Solution:
In order to find the area of 0.4265, we have to read across the table of 0.5.
1.4 + 0.05 = 1.45 standard deviation
So, 1.45 standard deviation is the shaded one in the standard normal curve. It is above the mean.
Advantages of Z score table
- It plays a significant role in comparing the raw figures of the data. The tests that are taken from the data at interval management are traced by this table.
- It is a crystal clear table as in its reliability and credibility. You can easily trace the right value.
- We have got several figures. So, by this z score table, we can easily compare the values of different aspects. The comparison doesn’t require any hard code formula. Just need to look insight the table.
